
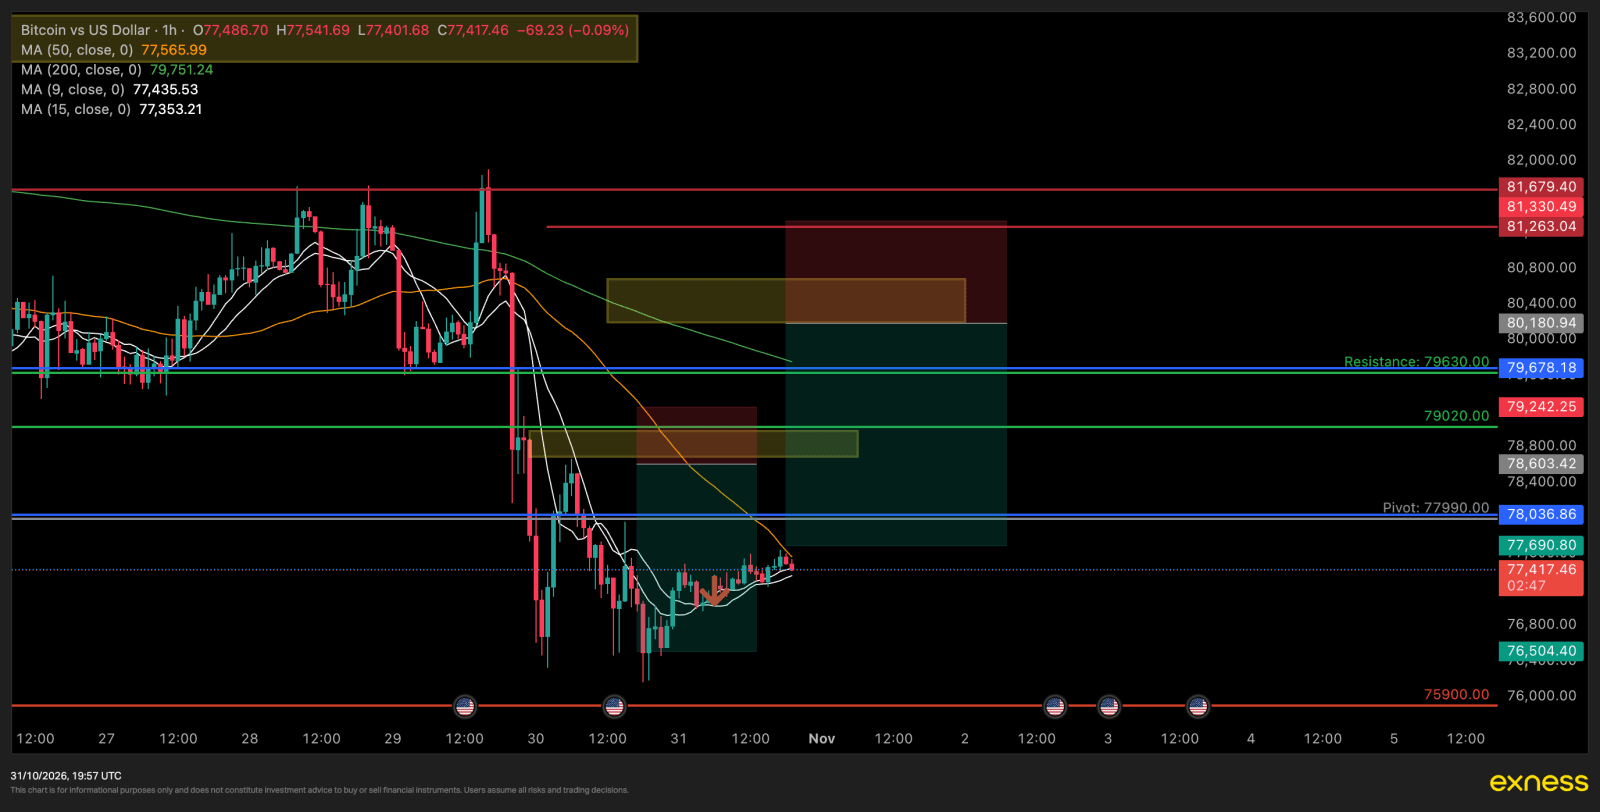
Bitcoin is trading at 77,618.96 at the time of writing, holding the tightest range it has printed in a week directly beneath the level it collapsed through.
Two sell zones follow, at two different heights. Which one matters depends entirely on how far the recovery is allowed to run.
Current Market Overview
Today opened at 77,368.76, held a low of 77,114.01 and a high of 77,796.01. That is a 682.00 range against a 14-day average true range of 1,971.80 — 35% of ADR.
Two thirds of the day's normal movement is still unspent. That cuts both ways, but it means neither zone is being drawn onto a market that has already exhausted itself.
The sessions either side of it are the context:
| Date | High | Low | Close |
|---|---|---|---|
| 29 Oct | 81,971.00 | 77,910.00 | 77,991.89 |
| 30 Oct | 78,804.01 | 76,325.98 | 77,368.77 |
| 31 Oct | 77,796.01 | 77,114.01 | 77,618.97 |
On 29 October Bitcoin fell 4,061 points from high to low and closed near the bottom of it. On 30 October it probed lower to 76,325.98 and recovered. Today it has done almost nothing — a 682-point box, roughly a third of the daily average.
That stillness is the setup. A market does not fall 4,000 points and then range quietly because it has found value. It ranges because the sellers are done pressing and the buyers are not yet willing to pay up. The resolution comes out of the range, and the weight of the prior move says which way.
Technical & Price Levels
Structure. The 29 October session broke everything below it in one move. Daily and four-hour both read down. The hourly is ranging inside the damage. There has been no higher high since the collapse — today's 77,796.01 sits well under 30 October's 78,804.01, which sits well under 81,971.00.
Liquidity above, and why there are two zones. The first real shelf is 78,804.01, the 30 October high. Above it sits a cluster where the 24 October low at 79,220.74 meets 79,368.67 and 79,506.00 — all broken support, now resistance. Then a gap, then a second cluster at 80,397.14, 80,849.95 and 80,888.16, and finally 81,300.00 and 81,823.00.
Two distinct pools with roughly 1,000 points of thin air between them. A single zone cannot cover both, which is the whole reason for the pair.
Liquidity below. 77,114.01 today's low, then 76,626.00, then 76,500.11, then 76,325.98 — the 30 October low and the lowest print since the collapse.
Volatility. Hourly ATR is 173.5, four-hour 967.9, daily 1,971.8. The hourly figure has compressed hard against a daily average that is still carrying last week's violence.
Positioning. Perpetual funding is +0.0100% — longs paying, mildly. Open interest has climbed from 95,938 to 97,541 BTC over the last 24 hours, so positions are being added into the range rather than closed. Retail accounts sit 2.59 long for every short; the top-position traders 1.68. The recent hourly taker ratio is 1.02, balanced.
A crowd adding longs into a market that has made no higher high since a 4,000-point break is the fuel these zones are drawn to use.
Zone One — 78,680.66 to 79,000.0
| Direction | Sell limit |
| Entry | 78,680.66 – 79,000.0 |
| Stop loss | 79,603.47 (922.81 from 78,680.66) |
| Target 1 | 77,685.59 — 1:1.1 |
| Target 2 | 76,500.0 — 1:2.4 |
| Target 3 | 75,500.0 — 1:3.4 |
Ratios are measured from the worst case, 78,680.66. Filled at the top of the band at 79,000.0 the risk falls to 603.47 and the same targets pay 1:2.2, 1:4.1 and 1:5.8.
The band is correctly placed. It straddles 78,804.01, the 30 October high, so the upper half of the zone only fills if that high is taken out first. That is the sweep this trade is built to sell into.
The stop is placed properly. At 79,603.47 it sits beyond all three members of the broken-support cluster — 79,220.74, 79,368.67 and 79,506.00 — and still under the next level at 79,845.86. A test of that cluster can fail without removing the trade, which is what a stop is for.
Widening the stop cost reward, and target one was moved to keep pace. At 922.81 of risk, target one now pays 1:1.08 — the first exit returns more than it stakes rather than less, which is what makes a half-off-at-target-one plan work rather than merely survive.
Targets. 77,685.59 is clean — it sits well in front of today's 77,114.01 low, with nothing between. 75,500.0 is clean as well, under the whole recent structure.
76,500.0 is the one to watch. It sits essentially on 76,500.11, a four-hour low from 30 October, rather than in front of it. A target placed on a pool can get missed by a handful of points while price reacts. 76,700 would be the structurally clean version at a slightly lower ratio.
Distance. The zone begins 1,062 points above price — about half a daily ATR. It needs a recovery to fill, but not an extraordinary one.
Zone Two — 80,241.8 to 80,700.0
| Direction | Sell limit |
| Entry | 80,241.8 – 80,700.0 |
| Stop loss | 81,250.0 (1,008.2 from 80,241.8) |
| Target 1 | 78,800.1 — 1:1.4 |
| Target 2 | 77,698.1 — 1:2.5 |
| Target 3 | 75,500.0 — 1:4.7 |
This zone sits over the second pool, 2,623 points above price — 1.33 daily ATR away. It needs a genuine multi-day recovery to trigger and may never do so.
The targets are the better set. 78,800.1 sits just under the 30 October high, 77,698.1 lands in clean space, and 75,500.0 is well clear of everything. None of the three is parked on a level.
The entry and the stop both have placement problems worth stating.
The band tops out at 80,700.0, which is below 80,849.95 and 80,888.16. So the zone fills in front of that cluster rather than beyond it — the opposite of zone one, which correctly straddles its level. Price can trigger this entry and then run another 190 points into resting orders before deciding anything.
The stop at 81,250.0 sits below 81,300.00, the 27 October high. A move that reaches up for 81,300 takes this stop out first and the trade never sees whether that level holds. 81,400 would have placed it beyond. As published, the stop is in front of the liquidity rather than behind it, which is the placement most likely to produce a loss that the chart afterwards says should not have happened.
None of this makes the zone untradeable. It makes it a zone where the stop will be hit by noise more often than its 1,008-point width implies, and it should be sized accordingly.
How the Two Fit Together
- A recovery that stalls at 78,804.01 fills zone one and zone two never arms.
- A recovery that clears 79,000 and runs the thin air to 80,400 stops zone one out and makes zone two the live trade.
- Continuation straight down from here fills neither. A zone that never triggers is not a loss.
Zone one is the one most likely to happen. Zone two is the insurance against being wrong about how far this bounce can go.
What Invalidates This
Zone one: an H1 close above 79,603.47. Not a wick — a close. A close above there says the whole broken-support cluster from 79,220.74 to 79,506.00 has been reclaimed rather than tested, and 79,845.86 is next.
Zone two: an H1 close above 81,250.0. Above there, 81,300 and 81,823 come back into play and the sequence of lower highs since 29 October is finished. Both zones are void at that point.
Two cautions for both:
- Both are counter-move entries into a range. The hourly is not trending down, it is compressing. Both rely on the daily and four-hour downtrend resolving it, which is probable but not certain.
- Zone two's stop is still in front of the level it should sit beyond. 81,250.0 sits below the 81,300.00 high, so a reach for that high removes the trade before the level is tested. Zone one's stop was moved to 79,603.47 and no longer has this problem. Zone two should be taken at half size for it.
Educational content only. This is not investment advice, not a recommendation, and not a solicitation to trade. FX Wired is not a licensed broker, dealer or investment adviser and does not accept, hold or manage client funds. Trading carries risk of total loss. Your decisions, your size and your risk are your own.
All prices quoted are from the live Binance BTC/USDT spot and perpetual feeds at the time of writing and will have moved by the time you read this. Your broker's BTCUSD quote will differ slightly.