
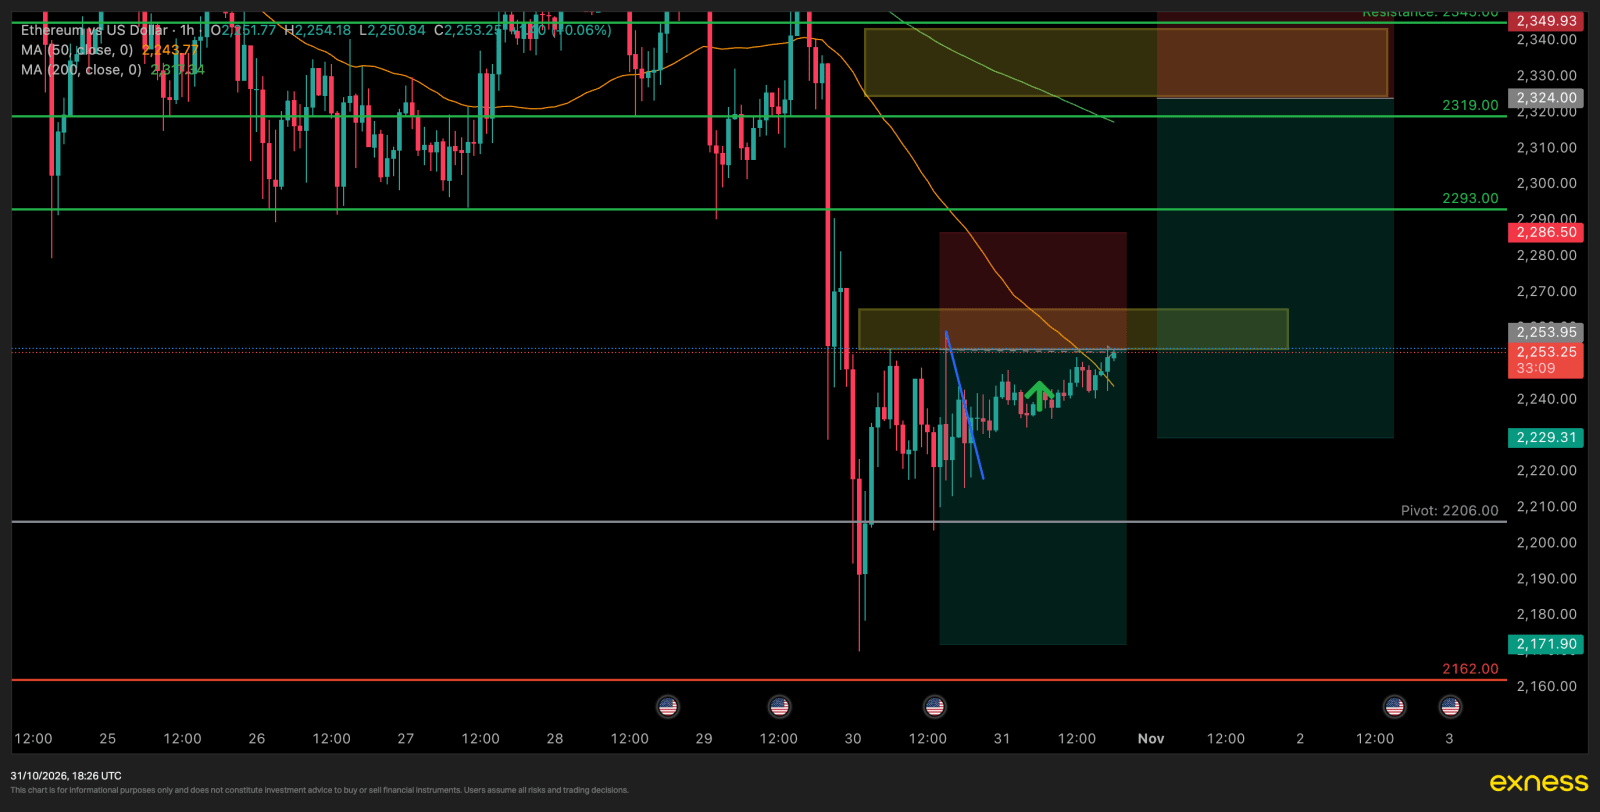
Ethereum is trading at 2,257.08 at the time of writing, two days into a tight consolidation that sits directly beneath the structure it broke on 29 October.
There are two sell zones on this chart, not one. They are not alternatives — they are the same idea placed at two different heights, and which one fills depends entirely on how far this bounce is allowed to run.
Current Market Overview
Today opened at 2,245.54, held a low of 2,237.00 and has pushed to 2,258.89. That is a 21.89 range against a 14-day average true range of 82.85 — 26% of ADR.
That number is the most useful thing on the page. Unlike a day that has already spent its budget, this one has barely started to move. Whatever direction resolves, there is room left in it.
The three prior sessions explain the compression:
| Date | High | Low | Close |
|---|---|---|---|
| 29 Oct | 2,379.55 | 2,233.00 | 2,253.13 |
| 30 Oct | 2,262.49 | 2,174.08 | 2,245.54 |
| 31 Oct | 2,258.89 | 2,237.00 | 2,257.08 |
On 29 October price fell 146.55 in a single session and closed at 2,253.13. The two days since have done almost nothing — 30 October spiked down to 2,174.08 and recovered, and today has traded a 22-point box. Price is coiled just under the level it lost.
The highs are the tell. 2,391.55 → 2,379.55 → 2,262.49 → 2,258.89. Four consecutive sessions of lower highs, with today's high failing to reclaim yesterday's. Nothing in that sequence argues for the upside yet.
Technical & Price Levels
Structure. The 29 October drop broke the 2,233.00 low and the market has spent two sessions failing to get back above it with conviction. H1 is ranging; H4 and D1 read down. A range inside a downtrend resolves with the trend more often than against it, and the ceiling of this range is where that gets decided.
Liquidity above — and this is why there are two zones. The first shelf is 2,262.49, the 30 October high, just 5 points over price. Above that the book is genuinely thin: nothing of structural weight until 2,337.10, then the 2,345 resistance band, then the 2,379.55 swing high. Two separate pools with a 75-point vacuum between them. A zone built on the first does not cover the second, and price travelling through that vacuum would leave a single-level entry stranded.
Liquidity below. 2,237.00 today's low, then 2,233.00 the broken 29 October low, then the 2,220.01 / 2,221.27 pair, then 2,208.40, and finally 2,174.08 — the lowest print of the month and the magnet underneath everything.
Volatility. Hourly ATR is 6.58, four-hour 37.59, daily 82.85. The hourly number collapsing to 6.58 against a daily 82.85 is the compression quantified: this market is holding its breath.
Positioning confirms the lean. Perpetual funding is −0.0066%, marginally negative. Retail accounts are 2.84 long for every 1 short; the top-position traders are 1.56. Open interest is flat at 2.35M ETH over the last 24 hours — no fresh commitment either way — and the most recent hourly taker ratio is 0.72, sellers ahead of buyers. A crowd that is nearly three-to-one long into four sessions of lower highs is fuel for a downside resolution, not a floor under it.
Zone One — 2,253.0 to 2,265.0
| Direction | Sell limit |
| Entry | 2,253.0 – 2,265.0 |
| Stop loss | 2,286.5 (33.5 from 2,253) |
| Target 1 | 2,210.0 — 1:1.3 |
| Target 2 | 2,190.0 — 1:1.9 |
| Target 3 | 2,170.0 — 1:2.5 |
Ratios are measured from the worst case, 2,253. Filled at the top of the band at 2,265 the risk drops to 21.5 and the same targets pay 1:2.6, 1:3.5 and 1:4.4.
The upper leg is the good one. 2,265 sits above the 2,262.49 high from 30 October. That is the whole point: the order does not fill unless that high is taken out first, so it waits for the sweep rather than guessing at a ceiling. The stop at 2,286.5 then sits beyond the swept level, which is where a stop belongs.
One execution note. With price at 2,257.08 the lower leg at 2,253 is below market and cannot be placed as a sell limit. Only the 2,265 half is a live pending order right now. That is not a flaw in the level — it is a consequence of price already trading inside the band.
At 33.5 of risk against an hourly ATR of 6.58 the stop is 5.1 ATR wide on the hourly, or 0.89 ATR on the four-hour. Wide by hourly standards, normal by the timeframe the structure actually lives on. It is sized for the move, not the noise.
Where the stop is honest and where it isn't. It is beyond 2,262.49, which is correct. But between 2,265 and 2,337 there is no structure at all, so nothing defends it — if the sweep turns into a genuine reclaim, that stop is alone out there. This is the zone's one real weakness, and it is exactly the weakness zone two exists to cover.
Targets. 2,210.0 sits just above the 2,208.40 reaction low, in front of the pool rather than on it. 2,190.0 sits in clean space between 2,208.40 and 2,174.08, unobstructed. 2,170.0 is the one to flag: it sits below 2,174.08, the monthly low, which puts the third target on the far side of the largest liquidity pool on the chart rather than in front of it. Price has to clear that pool for it to pay, and pools that size cause reactions. As a runner on a position already made free by target one that is an acceptable bet; as a primary target it would not be.
Zone Two — 2,323.4 to 2,342.0
| Direction | Sell limit |
| Entry | 2,323.4 – 2,342.0 |
| Stop loss | 2,366.3 (42.9 from 2,323.4) |
| Target 1 | 2,270.0 — 1:1.2 |
| Target 2 | 2,230.0 — 1:2.2 |
| Target 3 | 2,190.0 — 1:3.1 |
This is the better-constructed of the two, and it is worth being clear about why.
It sits over the second pool, not the first. 2,342 is above the 2,337.10 swing high and above the 2,345 resistance band marked on the chart. The stop at 2,366.3 clears both and still sits comfortably under the 2,379.55 swing high — so unlike zone one, this stop has structure above it rather than open air. If price runs the 2,337 stops and fails, the trade works; if it keeps going, 2,379.55 is where the thesis properly breaks, and the stop is out of the way of the noise in between.
It is 66 points away — 0.8 of a daily ATR. This zone requires a real bounce to fill. On a 26%-of-ADR day with 74% of the range unspent, that is not an unreasonable ask, but it is a genuine pending order that may simply never trigger. If ETH rolls over from here, zone one is the only one that pays and zone two never happens.
Target one at 2,270.0 sits above the 2,262.49 shelf — in front of it, correctly. Target three at 2,190.0 lands in the clean stretch above the monthly low, which is the right side of 2,174.08 and a better third target than zone one's.
Target two at 2,230.0 is the level to watch. It sits essentially on the 2,233.00 broken low from 29 October, not in front of it. Broken lows become resistance and attract resting orders, and a target placed on a pool rather than ahead of it can get missed by a few points before price reverses. 2,240 would be the structurally clean version, at the cost of dropping the ratio from 1:2.2 to roughly 1:1.9. The published number stays at 2,230 — but if the fill is marginal and price is stalling into 2,233, taking it early is the better read.
How the Two Fit Together
They are one plan at two heights, not two independent trades:
- If the bounce stalls at 2,262.49, zone one fills and zone two never arms. Full attention there.
- If the bounce clears 2,265 and runs the vacuum to 2,337, zone one's stop is hit for a full loss and zone two becomes the live trade with its stop properly defended. That is the sequence the pair is built for — zone one is the cheap first attempt, zone two is the one with structure behind it.
- If price simply falls from here, neither fills. A zone that never triggers is not a loss and should not be chased lower.
Sizing follows that logic: zone one is the speculative half, zone two is the one worth full size.
What Invalidates This
Zone one: an H1 close above 2,286.5. Not a wick — a close. A wick through the stop removes the trade and proves nothing. A close above it says the 2,262.49 sweep was a genuine break rather than a trap, and the next area of interest is 2,337.10 — which is where zone two is already waiting.
Zone two: an H1 close above 2,366.3. Above that the four-session sequence of lower highs is finished, 2,379.55 is in play, and the entire bearish structure described here stops being the right read. At that point both zones are void and the chart needs rebuilding from scratch.
Two cautions belong on the record for both:
- These are counter-move entries into a range. H1 is not trending down, it is ranging. Both zones rely on the H4 and D1 downtrend eventually resolving the range, which is the probable outcome but not the certain one.
- Only part of zone one is placeable. With price at 2,257.08 the 2,253 leg sits below market and cannot be entered as a limit order today.
Educational content only. This is not investment advice, not a recommendation, and not a solicitation to trade. FX Wired is not a licensed broker, dealer or investment adviser and does not accept, hold or manage client funds. Trading carries risk of total loss. Your decisions, your size and your risk are your own.
All prices quoted are from the live Binance ETH/USDT spot and perpetual feeds at the time of writing and will have moved by the time you read this. Your broker's ETHUSD quote will differ slightly.