
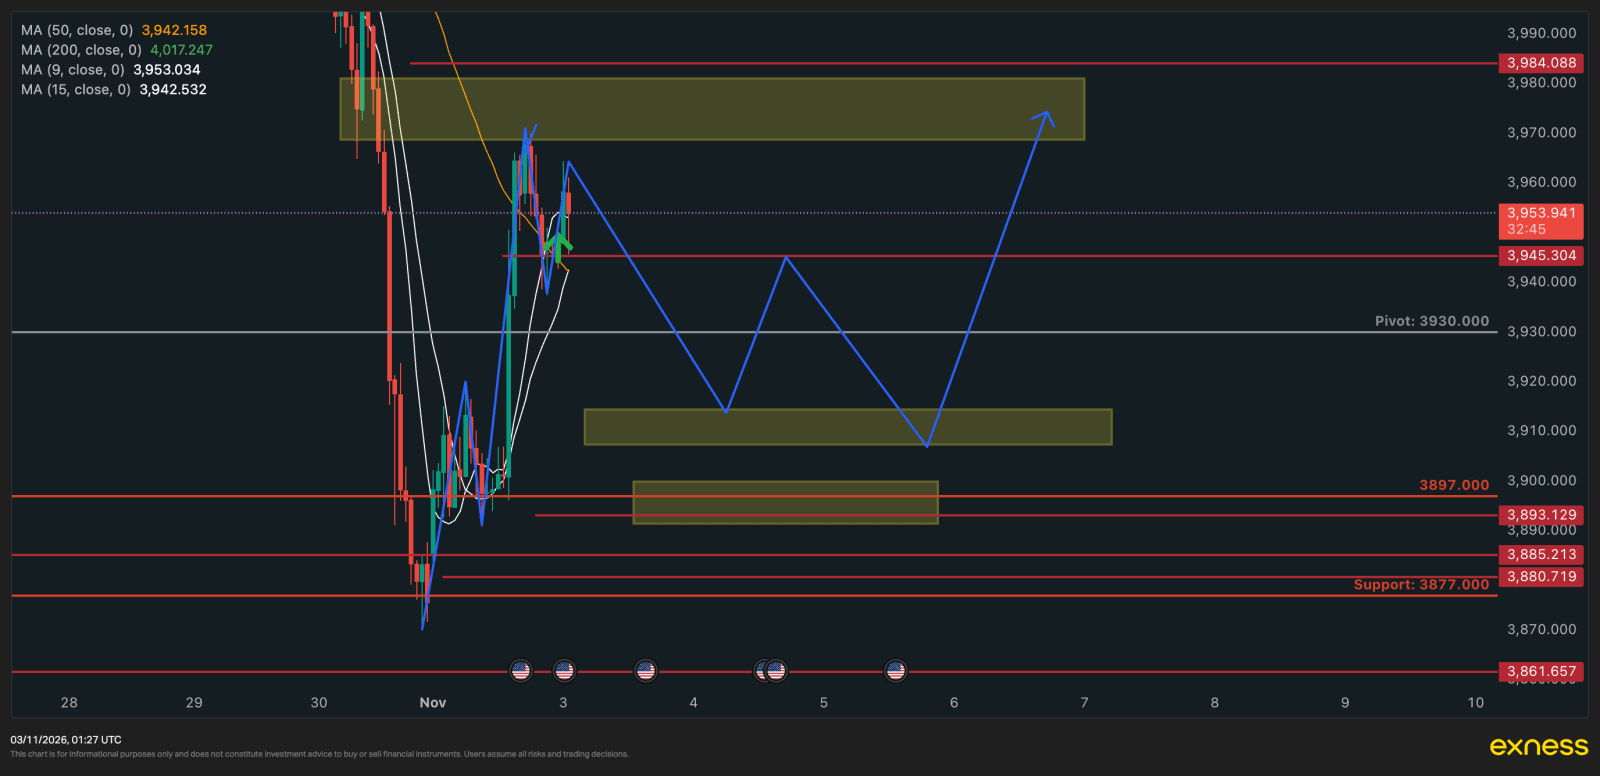
Gold is trading at 3,954.85 spot at the time of writing, with December futures at 3,964.90. Yesterday's recovery has held overnight, and today's zone is a buy back at the floor that recovery launched from.
Current Market Overview
Monday's session has run 3,952.80 to 3,974.50 so far — a 21.70 range against a 14-day average true range of 74.95, or 29% of ADR. That matters, because it is the opposite of yesterday's problem. On 2 November gold had already spent 118% of its average range before the session finished, which is why that day's setup was a sell into exhaustion. Today the day is barely a third used. There is room for a move in either direction.
The week behind it:
| Date | High | Low | Close |
|---|---|---|---|
| 27 Oct | 4,079.40 | 4,001.60 | 4,074.60 |
| 28 Oct | 4,097.20 | 4,036.90 | 4,051.60 |
| 29 Oct | 4,081.70 | 4,016.30 | 4,031.40 |
| 30 Oct | 4,038.20 | 3,879.30 | 3,898.90 |
| 2 Nov | 3,980.80 | 3,900.00 | 3,967.80 |
On 30 October gold lost 158.90 points and closed on the floor. On 2 November it bought back 80 of them. The highs are still stepping down — 4,097.20, then 4,081.70, then 4,038.20, then 3,980.80 — and nothing in that sequence has been reclaimed.
Technical & Price Levels
The base is the whole idea. Gold spent thirteen consecutive hours on 2 November trading between 3,900.00 and 3,928.10 before the 13:00 candle broke out and ran 76 points to 3,980.80. Hour after hour of two-way acceptance in a 28-point box, then a vertical exit. That box is now below price, and 3,903–3,914 sits in the middle of it.
Buying the origin of a breakout is the correct place to buy it. The sellers who were absorbed there are the reason the move happened, and if price returns, that is where they have to be absorbed again.
Liquidity below. 3,902.80, 3,900.10 and 3,900.00 from the base — three lows within 2.8 points of each other, which is a pool rather than a level. Below that, the 3,889.00 / 3,890.00 pair at Sunday's open, then 3,879.30, Friday's low and the lowest print of the entire move.
Liquidity above. 3,944.60, 3,947.40 and 3,948.90 from the hourly lows on the way up, then 3,963.30 / 3,963.60 / 3,964.70 where three hourly closes cluster, then today's high 3,974.50 and Sunday's 3,980.80.
Volatility. Hourly ATR is 16.50, daily 74.95.
The Zone
| Direction | Buy limit |
| Entry | 3,914.0 – 3,903.0 |
| Stop loss | 3,893.0 (21.0 from 3,914.0) |
| Target 1 | 3,936.0 — 1:1.0 |
| Target 2 | 3,952.0 — 1:1.8 |
| Target 3 | 3,964.0 — 1:2.4 |
The entry band sits 41 to 52 points below spot, so this is a limit order waiting for a pullback, not a chase. That is the right structure for it: entering against the immediate direction away from a drawn zone is the worst-performing timing bucket there is, but at a drawn zone the penalty largely disappears. Price has to come to this.
The stop is only half right, and it is the one thing to understand before sizing. At 3,893.0 it clears the 3,902.80 / 3,900.10 / 3,900.00 pool, which is the pool that matters — a stop sitting inside that cluster would be taken out by noise. But it sits 4 points above the 3,889.00 / 3,890.00 pair and 14 above 3,879.30. Stops belong beyond liquidity, not in front of it. If price comes down to hunt Sunday's open, this stop is removed on the way there, and the trade will be wrong before the level it is based on has actually failed. A stop under 3,877 would be structurally clean; the cost is that risk widens to 37 points and Target 1 falls to 1:0.6.
Target 3 is parked on liquidity. 3,964.0 sits in the middle of the 3,963.30 / 3,963.60 / 3,964.70 cluster — the exact prices where the last three hourly closes stalled. Targets belong in front of a pool, not on it, because the pool is where the opposing orders sit. 3,958.0 would clear it with room to spare, at 1:2.1 rather than 1:2.4. Roughly a tenth of an R for a materially better chance of actually being paid.
Targets 1 and 2 are correctly placed. 3,936.0 sits 8.6 points in front of the 3,944.60 pool. 3,952.0 sits in the open stretch between 3,948.90 and the 3,963 cluster, unobstructed on both sides. Half off at 3,936 and stop to entry is the right plan for a zone whose stop is thinner than it looks.
What Invalidates This
An H1 close below 3,893.0. Not a wick — a close. A genuine hourly close under the base means the 2 November breakout has been fully given back, and the next area of interest is 3,879.30, Friday's low, with nothing structural between here and there.
One caution belongs on the record: this is a counter-trend long. The daily has been down since 16 October, the last four daily highs have each been lower than the one before, and a real reversal needs 4,038.20 back — 73 points above spot. What this trade is buying is an intraday base inside a daily downtrend, which is a different and smaller claim than calling the bottom. Size it as the smaller claim.
Educational content only. This is not investment advice, not a recommendation, and not a solicitation to trade. FX Wired is not a licensed broker, dealer or investment adviser and does not accept, hold or manage client funds. Trading carries risk of total loss. Your decisions, your size and your risk are your own.
Prices quoted are from live spot and futures feeds at the time of writing and will have moved by the time you read this. Your broker's XAUUSD quote will differ slightly.