
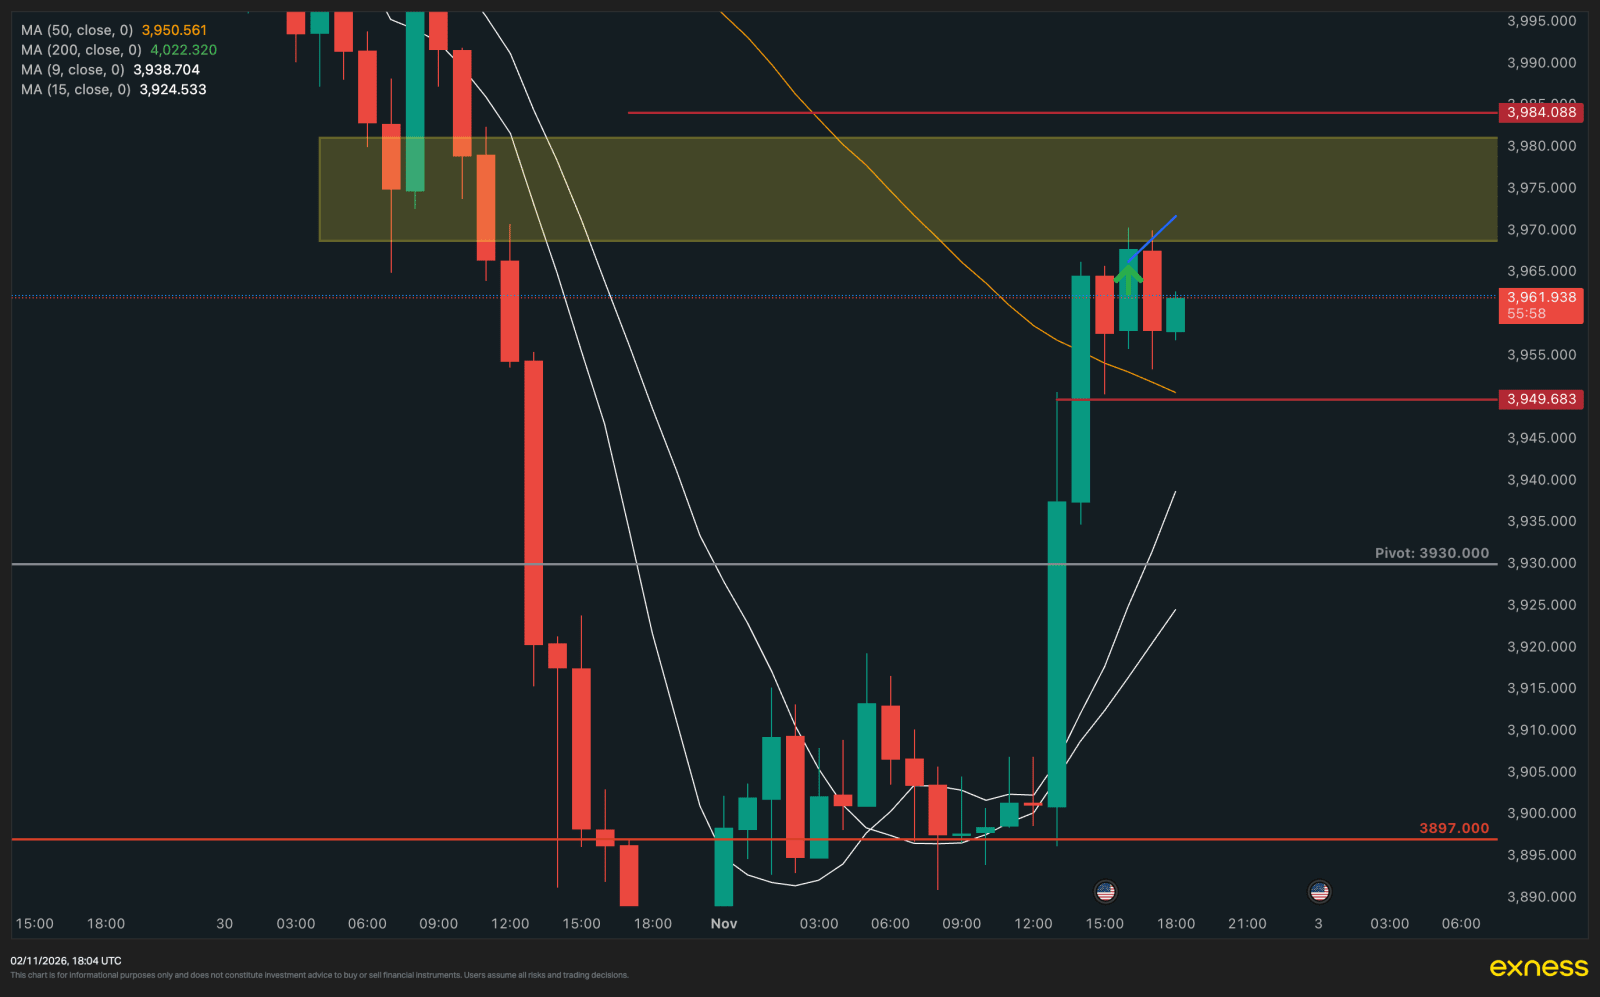
Gold is trading at 3,962.56 spot at the time of writing, having recovered almost everything Friday took off it — and having spent more than a full day's range doing it.
Current Market Overview
The session opened at 3,890.00, held a low of 3,889.00, and has run to a high of 3,980.80. That is a 91.80 range against a 14-day average true range of 77.57 — 118% of ADR, before the session is even finished.
That number is the single most important thing on this page, and it cuts directly against the buyers rather than the sellers. A day that has already travelled more than its average does not usually find another leg in the same direction. The move is not necessarily wrong. It is largely done.
The week behind it explains why the recovery happened at all:
| Date | High | Low | Close |
|---|---|---|---|
| 29 Oct | 4,081.70 | 4,016.30 | 4,031.40 |
| 30 Oct | 4,038.20 | 3,879.30 | 3,898.90 |
| 2 Nov | 3,980.80 | 3,889.00 | 3,966.20 |
On 30 October gold fell 158.90 points and closed on the floor. Today it gapped up and bought back 91 of them. That is a violent two-way week, and the second move has not undone the first: 3,980.80 is still well below 4,038.20, which is well below 4,081.70.
The highs are still stepping down. 4,220.40 on 16 October, then 4,164.30, then 4,097.20, then 4,081.70, then 4,038.20, and now 4 sessions later a recovery that tops out at 3,980.80. Nothing in that sequence has been reclaimed.
Technical & Price Levels
Structure. The daily is down and has been since 16 October. Today is a recovery inside that, not a reversal of it — a reversal would need to take 4,038.20 back, and this move stopped 57 points short of it.
Liquidity above. The level that matters is 3,980.80, today's high, sitting about 18 points over spot. Above that there is open space until 4,036.90 and 4,038.20, where the 28 and 30 October lows sit as broken support, then 4,081.70.
Liquidity below. 3,963.30 and 3,960.60 from the last two hourly candles, then 3,944.60, then 3,905.39, then the 3,889.00 / 3,890.00 pair at today's open, and finally 3,879.30 — Friday's low and the lowest print of the move.
Volatility. Hourly ATR is 16.14, daily 77.57. The hourly figure matters a great deal for this particular zone, for reasons set out below.
The gap. Gold opened today at 3,890.00 against Friday's 3,898.90 close. That gap has already been filled and left behind, so it is not an argument either way — worth saying only because weekend gaps often get cited as if they were.
The Zone
| Direction | Sell limit |
| Entry | 3,968.0 – 3,980.0 |
| Stop loss | 3,982.0 (14.0 from 3,968.0) |
| Target 1 | 3,954.0 — 1:1.0 |
| Target 2 | 3,934.0 — 1:2.4 |
| Target 3 | 3,924.0 — 1:3.1 |
The location is the strong part. This sells into the high of a session that has already spent 118% of its average range, inside a daily downtrend whose last four highs have each been lower than the one before. Measured across thousands of setups, entries taken after a full ADR has been used score −0.117R — and that penalty falls on the side continuing the move. Here the zone is on the other side of it. The exhaustion argument works for this trade rather than against it.
The stop is the weak part, and it needs stating plainly. At 3,982.0 it sits 1.2 points above 3,980.80, today's high. Hourly ATR is 16.14, so the clearance behind that stop is 0.07 ATR. A level that has just been reached and rejected usually gets retested, and a retest that overshoots by two points — well within a single minute's movement in gold — removes this trade before the level has had a chance to hold or fail.
The upper half of the band carries almost no room. A fill at the top of the entry band at 3,980.0 leaves 2.0 points to the stop. Spread and slippage alone can account for that. The lower leg at 3,968.0 is the one with a defensible 14 points behind it; the closer a fill lands to 3,980, the closer the stop sits to a coin flip.
None of this makes the idea wrong. It means the zone is likely to be stopped more often than its thesis deserves, and the way to read the published ratios is as the best case rather than the expected one.
Targets. 3,954.0 sits below the 3,960.60 hourly low with clear space underneath — in front of the next pool rather than on it. 3,934.0 lands in the open stretch between 3,944.60 and 3,905.39, unobstructed. 3,924.0 sits in the same clear space, still comfortably above the 3,905.39 and 3,889.00 pools. None of the three is parked on a level, which is the right way round.
What Invalidates This
An H1 close above 3,982.0. Not a wick — a close. Given how tightly that stop sits to the session high, wicks through it should be expected rather than treated as information. A genuine hourly close above says the recovery has more in it than a single day's range suggested, and the next area of interest is the broken support at 4,036.90–4,038.20.
Two cautions belong on the record:
- This is a counter-trend entry against the session. Today's direction is up, hard — 76 points off the open. Entering against momentum away from a drawn zone measured −0.121R, the worst timing bucket tested. At a drawn zone that penalty largely disappears, which is why this is a limit order sitting above price rather than a market sell. But it halves the case for size.
- 118% of ADR is spent. That supports the direction of this trade and simultaneously says the easy part of the day is over. Thin, erratic movement is more likely from here than another clean leg.
Half size. The location earns the trade; the stop does not earn full conviction.
Educational content only. This is not investment advice, not a recommendation, and not a solicitation to trade. FX Wired is not a licensed broker, dealer or investment adviser and does not accept, hold or manage client funds. Trading carries risk of total loss. Your decisions, your size and your risk are your own.
Prices quoted are from live spot and futures feeds at the time of writing and will have moved by the time you read this. Your broker's XAUUSD quote will differ slightly.